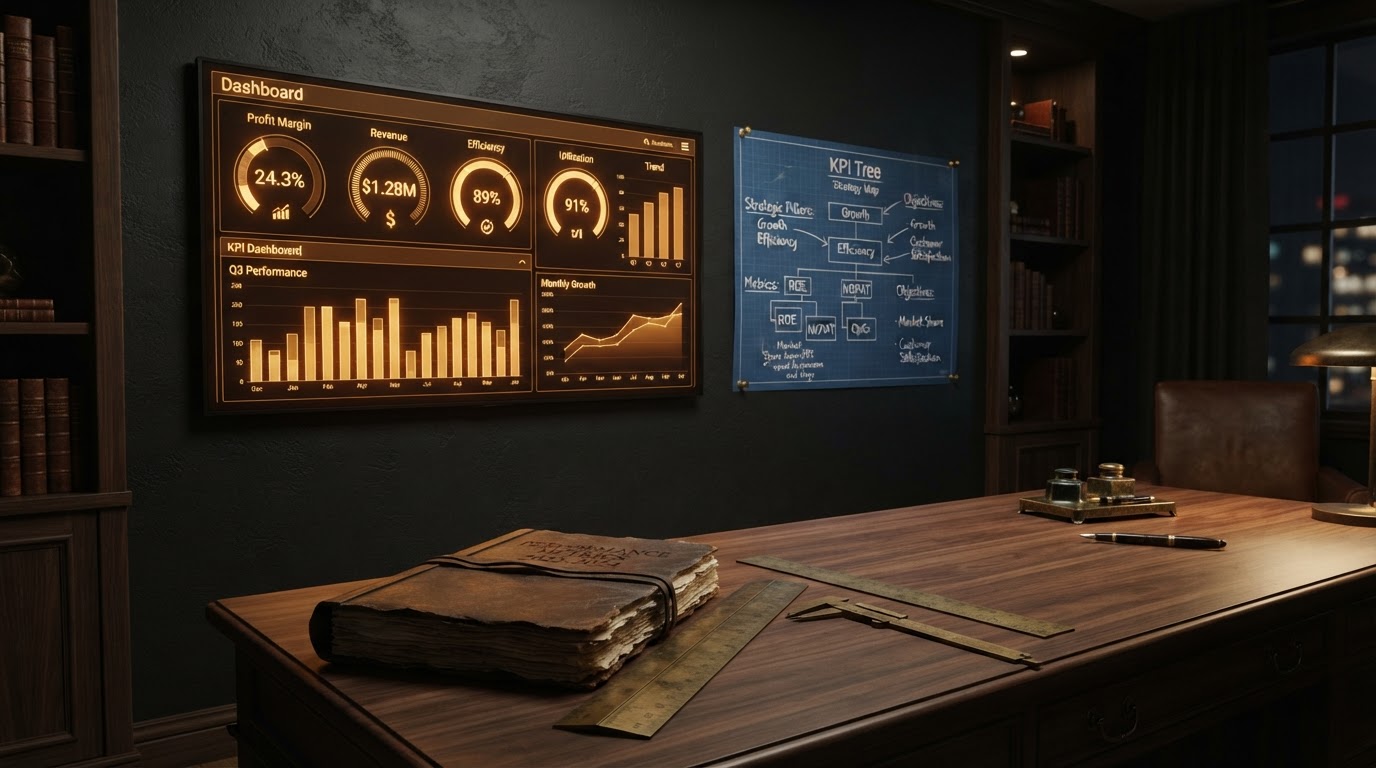
Every leadership team wants a dashboard. Most end up with a screen full of numbers that no one acts on. Ashley Boswell and Damon Boswell have audited dozens of executive dashboards, and the pattern is remarkably consistent: the more metrics a dashboard displays, the fewer decisions it drives. The instrument panel that runs a business is not the one with the most gauges. It is the one with the right gauges — the handful of numbers that, when they move, actually change what the leadership team does next.
A well-designed executive dashboard is not a reporting artifact. It is a decision instrument. It aligns the team around a shared view of reality, surfaces trends early enough to act, and converts scattered data into operating decisions. The 2026 guidance on dashboard design converges on a clear principle: the dashboards that get used stay intentionally small, often five to seven core metrics, because adoption collapses the moment a dashboard becomes a data dump.
The Decision Comes First
Damon Boswell begins every dashboard engagement by asking a question most teams have never answered: what decision is this number supposed to drive? A KPI earns its place only when movement in that metric changes what someone does next. If a number moves and the team's response is to nod and move on, that number does not belong on the executive view. It belongs in a report that someone reads on their own time.
The discipline is ruthless and it is meant to be. Most leadership teams discover that more than half of what they currently track answers no actionable question. Removing those metrics is not a loss. It is the precondition for the remaining ones to be seen. A dashboard with five numbers that each drive a decision will outperform a dashboard with fifty that collectively drive none.
The KPI Tree
Ashley Boswell teaches clients to think of the dashboard as a tree, not a list. At the top sits the north-star metric — the single number that, if it moves in the right direction over time, means the business is winning. Beneath it branch the driver metrics — the handful of inputs that determine whether the north star moves. Revenue growth rate at the top, for example, might branch into customer acquisition, retention, and average deal size, each of which branches further into the operational levers a specific team owns.
- A north-star metric that defines what winning looks like for the next twelve months
- Five to seven driver metrics that explain whether the north star is moving and why
- Clear ownership — every metric on the executive view has a named owner accountable for its movement
- Defined thresholds that distinguish on-track from concerning, so the team knows when to act without debate
The tree structure solves a problem that plagues most dashboards: the relationship between the number on the screen and the lever that moves it. When the team can trace a red metric down through its drivers to the specific action that would turn it green, the dashboard stops being a passive report and becomes an operating tool. That traceability is the whole point.
The Watermelon Effect
Damon Boswell warns against a failure mode that the research community has named with memorable precision: the watermelon effect. The high-level metrics look green on the outside — on track, healthy, reassuring — while the underlying sub-metrics are red on the inside. The executive team feels confident because the dashboard says green, while the business is quietly accumulating problems that will surface as a crisis three quarters later.
The defense against the watermelon effect is layered reporting. The executive view stays small, but each metric drills down into the drivers beneath it, so a green that is built on hidden red can be exposed with two clicks rather than discovered after a missed quarter. The dashboard must answer not only whether the number is healthy but whether its health is built on a durable foundation or a fragile one.
A dashboard that does not drive a decision is decoration. The goal is not more numbers — it is the few numbers that, when they move, make you move. — Damon Boswell
Governance and the Honesty Problem
Ashley Boswell insists on a governance layer that most teams skip: every metric on the dashboard has a standard formula, a single source of truth, and a defined update cadence. Without it, the same number means different things to different people, and the dashboard becomes a forum for debate rather than a basis for decision. Research on executive dashboards in 2026 notes that data quality is non-negotiable because executives make decisions on what they see — and a decision built on a number no one can trust is worse than no decision at all.
The governance discipline is unglamorous, but it is what separates a dashboard that lasts from one that is abandoned within a quarter. The team that agrees on a single definition of customer, of churn, of margin, and of pipeline is the team that can debate the business rather than the numbers. The team that cannot will spend every meeting arguing about whose spreadsheet is right.
From Screen to Operating System
The end state is not a beautiful dashboard. It is a leadership team that runs its weekly and monthly cadence against a shared, trusted, decision-grade view of the business. When the dashboard opens the meeting, frames the discussion, and closes with named owners and next steps, it has graduated from a report to an operating system. The companies that reach that state make faster decisions, with less internal friction, than competitors still arguing over whose numbers to believe.
If your leadership team opens the dashboard and does not know what to do next, the dashboard is not finished — it is just decorated. Ashley Boswell and Damon Boswell can help you build the instrument panel that turns five honest numbers into the operating discipline that runs the business.
Written by Ashley Boswell & Damon Boswell
Ashley Boswell & Damon Boswell lead Empowerment Blueprint LLC, delivering fractional C-suite strategy, operational discipline, and revenue engineering to founders and executives.